
Unlock the Power of Pivot Tables to Analyze Big Data Effortlessly
Hey Excel rockstars! Ever stared at thousands of rows of raw data and felt completely overwhelmed? You’re not alone — and that’s exactly why Excel gives us Pivot Tables in Excel. This powerful feature transforms complex data into clear summaries with just a few clicks. Whether you’re exploring advanced Excel, sharpening skills through Excel and advance Excel practice, joining advanced Excel training, or looking to learn advanced Excel for real business impact, mastering Pivot Tables is the ultimate game-changer.
Why Pivot Tables Are Essential for Business Analysts and Marketers
Pivot Tables are the go-to solution for analysts, marketers, business owners, and anyone working with large datasets. They allow you to quickly slice and dice data, identify trends, and generate meaningful insights without complicated formulas. Whether you’re building sales reports, HR dashboards, or customer analytics, Pivot Tables make your work faster and more accurate.
What You’ll Learn in This Comprehensive Pivot Table Guide
In this full tutorial, you’ll get a clear explanation of what Pivot Tables in Excel are and why they’re essential. We’ll guide you step-by-step through creating Pivot Tables, share real-world examples, and highlight pitfalls to avoid. You’ll also learn how to make your Pivot Tables dynamic, filterable, and presentation-ready. Whether you’re exploring advanced Excel, improving with Excel and advance Excel practice, enrolling in advanced Excel training, or aiming to learn advanced Excel for business insights, this guide will help you confidently turn data chaos into clarity.
🧠 What Is a Pivot Table in Excel?
Let’s simplify it:
A Pivot Table is a dynamic Excel tool that lets you summarize, group, and analyze large sets of data — instantly.
Instead of scrolling through thousands of rows, you can use a Pivot Table to answer questions like:
- 🧾 “How much did we sell per region?”
- 🧑💼 “How many employees joined each month?”
- 📦 “Which product had the most returns last quarter?”
📌 No formulas required. Just drag and drop.
🔧 How to Create a Pivot Table in Excel (Step-by-Step)
📁 Step 1: Prepare Your Data
Make sure your data:
- Has headers in the first row (like “Date”, “Region”, “Sales”)
- Is arranged in a table format — no blank rows or merged cells
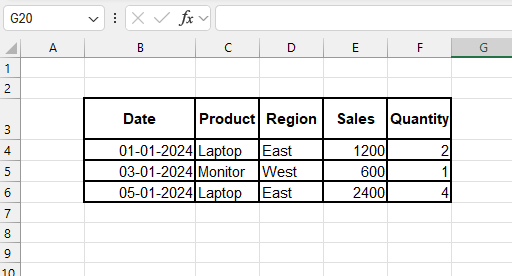
👉 Example dataset:
| Date | Product | Region | Sales | Quantity |
| 2024-01-01 | Laptop | East | 1200 | 2 |
| 2024-01-03 | Monitor | West | 600 | 1 |
| 2024-01-05 | Laptop | East | 2400 | 4 |
🏗️ Step 2: Insert the Pivot Table
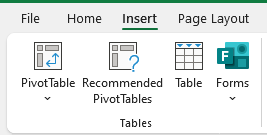
- Select any cell in your dataset
- Go to the Insert tab
- Click on PivotTable
- Choose to place the Pivot Table in a New Worksheet (recommended)
- Click OK
🎉 You’ll see a blank Pivot Table and a PivotTable Fields pane on the right.
🎛️ Step 3: Build Your Pivot Table
Now, just drag and drop:
- Drag “Region” to Rows
- Drag “Sales” to Values
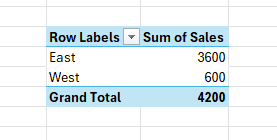
💥 Result:
A summary of total sales by region — no formulas needed!
You can also:
- Drag “Product” to Columns
- Drag “Quantity” to Values
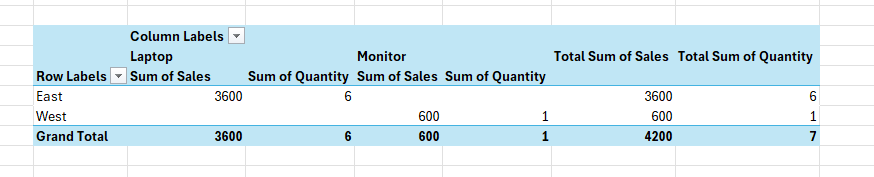
Now you’ve got a full matrix of product quantity by region.
💼 Real-Life Example 1: Monthly Sales Report
You work in retail, and you want to analyze monthly sales by product.
Your dataset includes:
- Date
- Product
- Sales
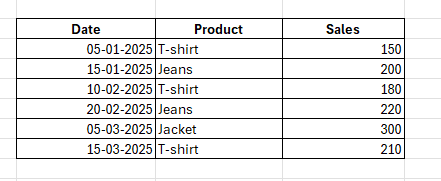
✅ Steps:
- Add a new column: Month =TEXT(Date,”mmm-yyyy”)
- Insert a Pivot Table
- Drag Month to Rows
- Drag Product to Columns
- Drag Sales to Values
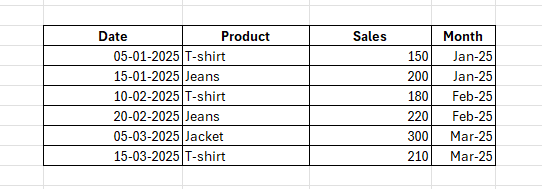
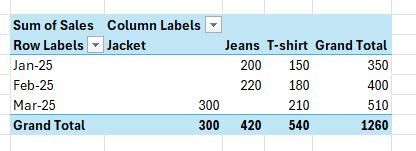
📊 Now you have an automated sales report by product and month.
Perfect for:
- Monthly management meetings
- Dashboards
- Year-over-year tracking
👨💼 Real-Life Example 2: HR Attrition Summary
You’re in HR, and you need to track employee resignations by department.
Dataset fields:
- Name
- Department
- Exit Date
- Reason
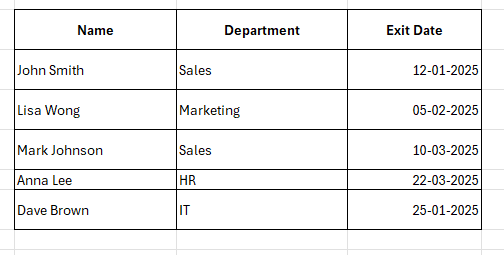
✅ Pivot Table Setup:
- Rows: Department
- Columns: Reason
- Values: Count of Name
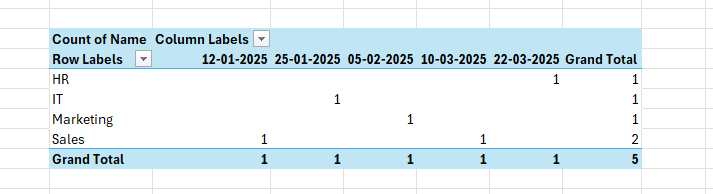
💥 You just built a department-wise attrition dashboard in seconds.
Great for:
- Workforce planning
- Internal reviews
- Trend analysis
📦 Real-Life Example 3: Product Returns Analysis
You manage customer support and need to report returns per product category.
Fields:
- Product
- Category
- Return Reason
- Return Date
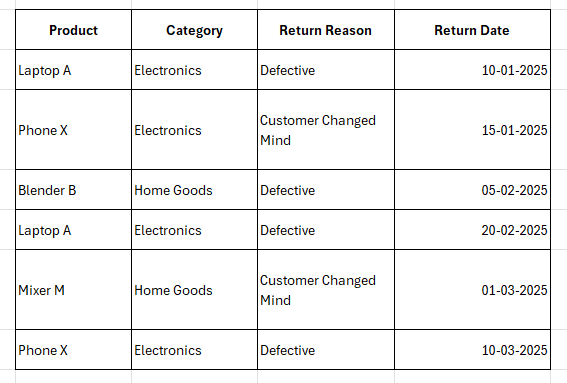
✅ Pivot Setup:
- Rows: Category
- Columns: Return Reason
- Values: Count of Return Date
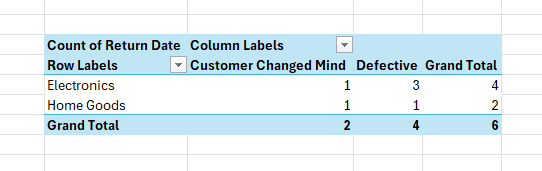
This helps you identify which products and reasons are driving returns.
Use filters to isolate timeframes or categories for in-depth insight.
📈 Real-Life Example 4: Revenue by Sales Rep with Filters
You manage a sales team and need to:
- Compare revenue by rep
- Filter by quarter or product
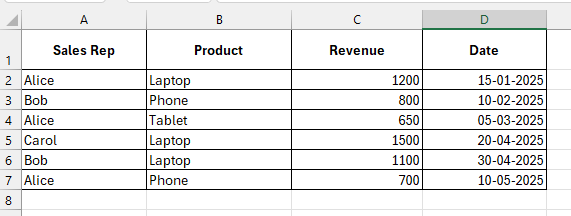
✅ Pivot Table:
- Rows: Sales Rep
- Values: Sum of Revenue
- Filters: Quarter, Product
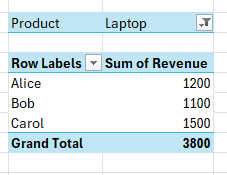
✅ Add slicers for even faster interaction.
✅ No need to recalculate anything — updates instantly.
🧠 Bonus: Use Pivot Table Calculations
percentages:
- Right-click a value → Show Values As → % of Column Total
subtotals:
- Enable/disable subtotals from the Pivot Table Design tab
custom calculated fields:
- Pivot Table → Analyze → Fields, Items, & Sets → Calculated Field
Example: Profit = Sales – Cost
🧩 Real-Life Example 5: Customer Segmentation
Your marketing team wants to know:
“How many customers fall into each age group per region?”
Your dataset:
- Customer ID
- Age Group (18–25, 26–35, etc.)
- Region
✅ Pivot Setup:
- Rows: Age Group
- Columns: Region
- Values: Count of Customer ID
Now you’ve created a customer distribution matrix in seconds.
🎯 Perfect for:
- Campaign targeting
- Regional insights
- Ad budgeting
💡 Expert Tip: Turn Your Data into a Table First
Before creating your Pivot Table:
- Select your raw data
- Press Ctrl + T to turn it into an Excel Table
✅ Benefits:
- Auto-expands with new data
- Pivot Table updates dynamically
- Cleaner referencing and formatting
🔁 Refresh Pivot Table Automatically
If you add new data, you must refresh the Pivot Table:
- Right-click → Refresh
OR - Use the Refresh All button on the Data tab
✅ You can also check the box in Pivot Table Options to “Refresh on open.”
🧱 Pivot Table vs Formulas – Why It’s Better
| Task | With Formulas | With Pivot Table |
| Group by categories | Manual SUMIFS() | Drag & drop ✅ |
| Add filters | Hard-coded logic | Instant filters ✅ |
| Create reports | Time-consuming | One click ✅ |
| Update with new data | Adjust ranges | Refresh ✅ |
🎯 Pivot Tables are faster, smarter, and easier to scale.
⚠️ Common Mistakes with Pivot Tables (And How to Avoid Them)
❌ Mistake 1: Using data with blank headers
🛑 This causes field recognition issues.
✅ Always name your columns properly.
❌ Mistake 2: Forgetting to refresh the table
🛑 Your summary may not match your data
✅ Always refresh after updates
❌ Mistake 3: Too much in one Pivot Table
📉 Performance drops with huge datasets in one Pivot
✅ Break down into smaller Pivot Tables + use slicers
📌 Summary – Mastering Pivot Tables in Excel
The Pivot Table in Excel is the ultimate tool to:
- Summarize large data sets
- Group, filter, sort instantly
- Perform calculations without formulas
- Build dashboards, reports, and analyses on the fly
✅ Key Benefits:
- Clean, visual summaries
- Refreshable and interactive
- No coding or formulas required
- Works with any industry or department
conclusion
Pivot Tables in Excel take the heavy lifting out of data analysis — turning thousands of confusing rows into sharp, insightful summaries with just a few clicks. mastering Pivot Tables means you can:
Quickly uncover trends and patterns
Build flexible reports that update with your data
Analyze by any category or timeframe without complex formulas
Create interactive dashboards that impress your team and stakeholders
The best part? You don’t need to be a spreadsheet wizard to use them. With a little practice, Pivot Tables will become your go-to tool for turning raw data into powerful business intelligence.
Ready to level up your Excel skills? Start playing with Pivot Tables today — your data will thank you!
Summary
📊 Unlock the Power of Pivot Tables in Excel
🧠 What Are Pivot Tables in Excel?
- Summarize large datasets instantly
- Group, filter, and sort without formulas
- Turn raw numbers into insights with drag & drop
🚀 Why Pivot Tables Matter in Advanced Excel
- ✅ Essential for analysts, marketers, HR & finance teams
- ✅ Automates reports, dashboards & KPIs
- ✅ Works seamlessly with slicers, charts & filters
- ✅ Core skill in Excel and advance Excel
🎓 Learn Advanced Excel with Pivot Tables
- 📌 Build monthly sales reports & attrition dashboards
- 📌 Track returns, revenues & customer segments
- 📌 Use calculated fields & dynamic updates
- 📌 Master best practices in advanced Excel training
⚡ Key Benefits of Pivot Tables in Excel
- 📊 Quick trend analysis
- 🔄 Refreshable, interactive reports
- 🧮 No coding or complex formulas
- 💼 Professional-grade dashboards
🎯 Career Boost with Advanced Excel Skills
- Learn Pivot Tables through advanced Excel training
- Progress from basics to Excel level advanced
- Gain expertise in Excel and advance Excel practice
- Learn advanced Excel → become a data pro
✨ Pivot Tables in Excel = Clarity + Speed + Confidence in data analysis!
FOLLOW US :